
How To Use The Long Equity Data Terminal
The Long Equity Data Terminal is our new all-in-one stock screener. It unifies all of our previously separate tools into one place, while also adding some new functionality along the way.
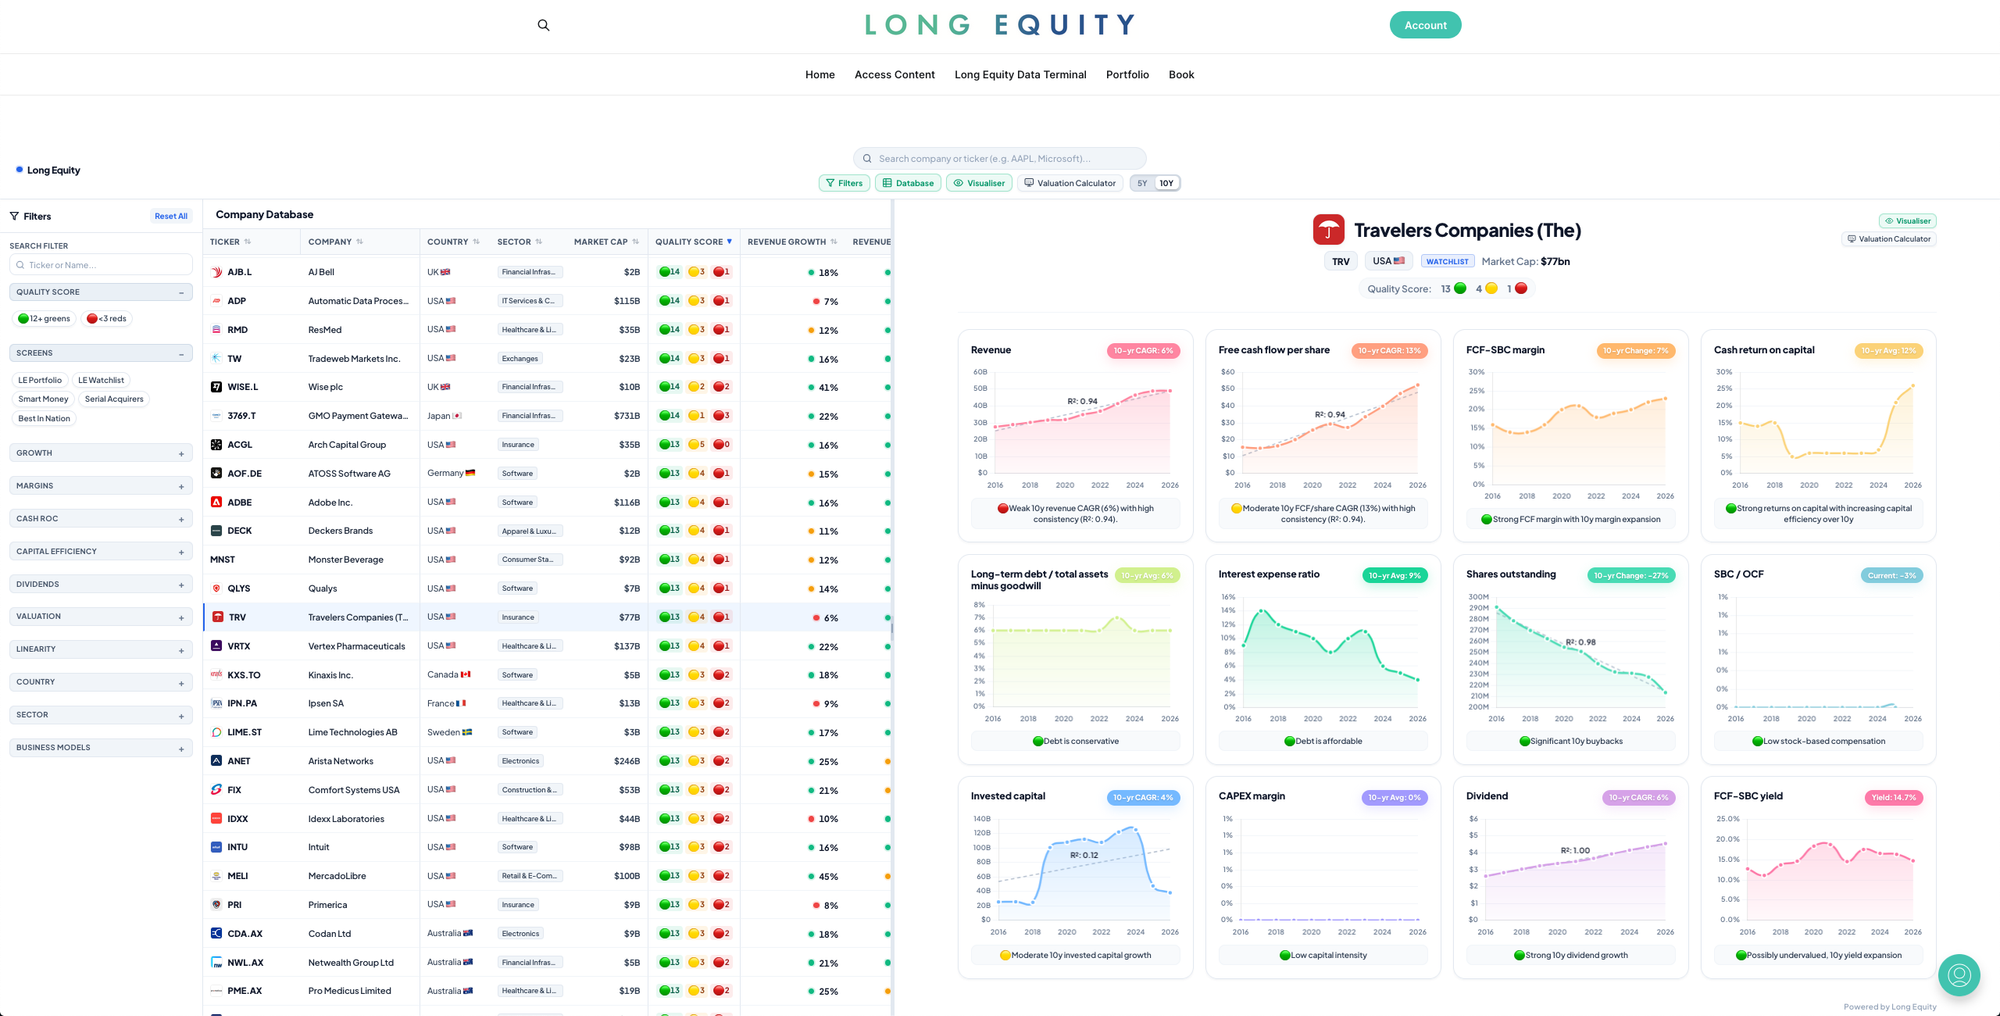
The general layout
The terminal is divided into three:
- filters on the left,
- the database in the middle, and
- the data visualiser on the right.
Clicking these buttons...

...allows you to toggle being whether these elements are visible or not. You can also toggle between the Visualiser and the Valuation Calculator.
The default view presents calculations based on the last 10 years of data, e.g. 10yr Revenue growth. You can toggle between seeing calculations based on 10 years or 5 years of data, using the below button.

Coverage
The terminal currently covers over 5,000 companies across over 25 countries.
You can filter by country:
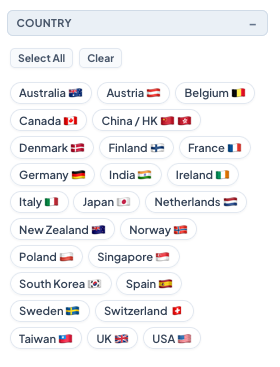
If you want to look at only non-USA companies, then click "Select All", then deselect "USA".
By sector:
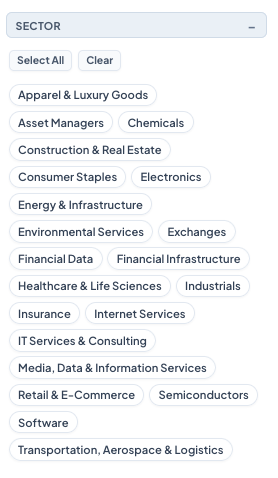
And by a whole lot more:
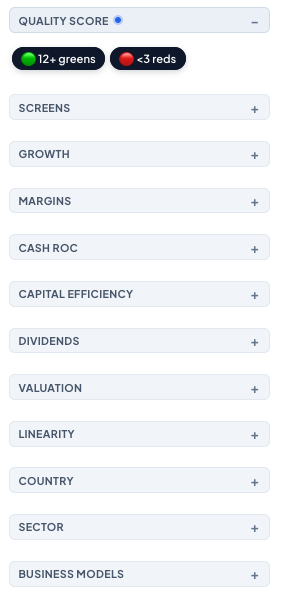
Built to be intuitive
You will soon notice that hovering over most elements reveals a description of the metric you're looking at.
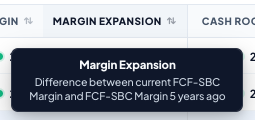
You can also hover over certain elements to see a summarised analysis of that metric.

Quality scores
Central to the terminal is the quality scoring system. Each numerical metric (excluding valuations) are assigned a green, amber or red rating. A quality score is then calculated by summing up all the individual scores. There are 18 metrics in total. The highest rating is: 🟢18, while the lowest rating is: 🔴18.
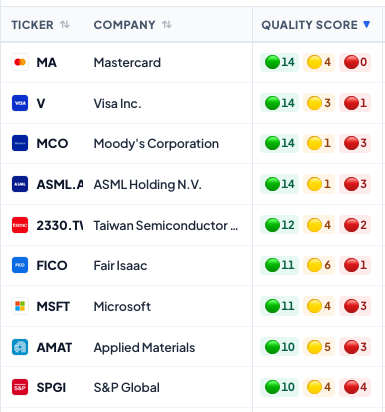
Scrolling through the database reveals how each metric is contributing to the overall rating.

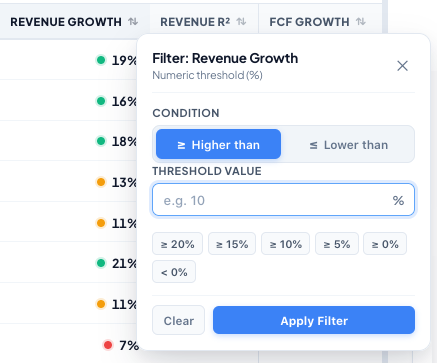
If you right click over a column heading, a drop-down menu appears that allows you to apply a filter to that specific column.
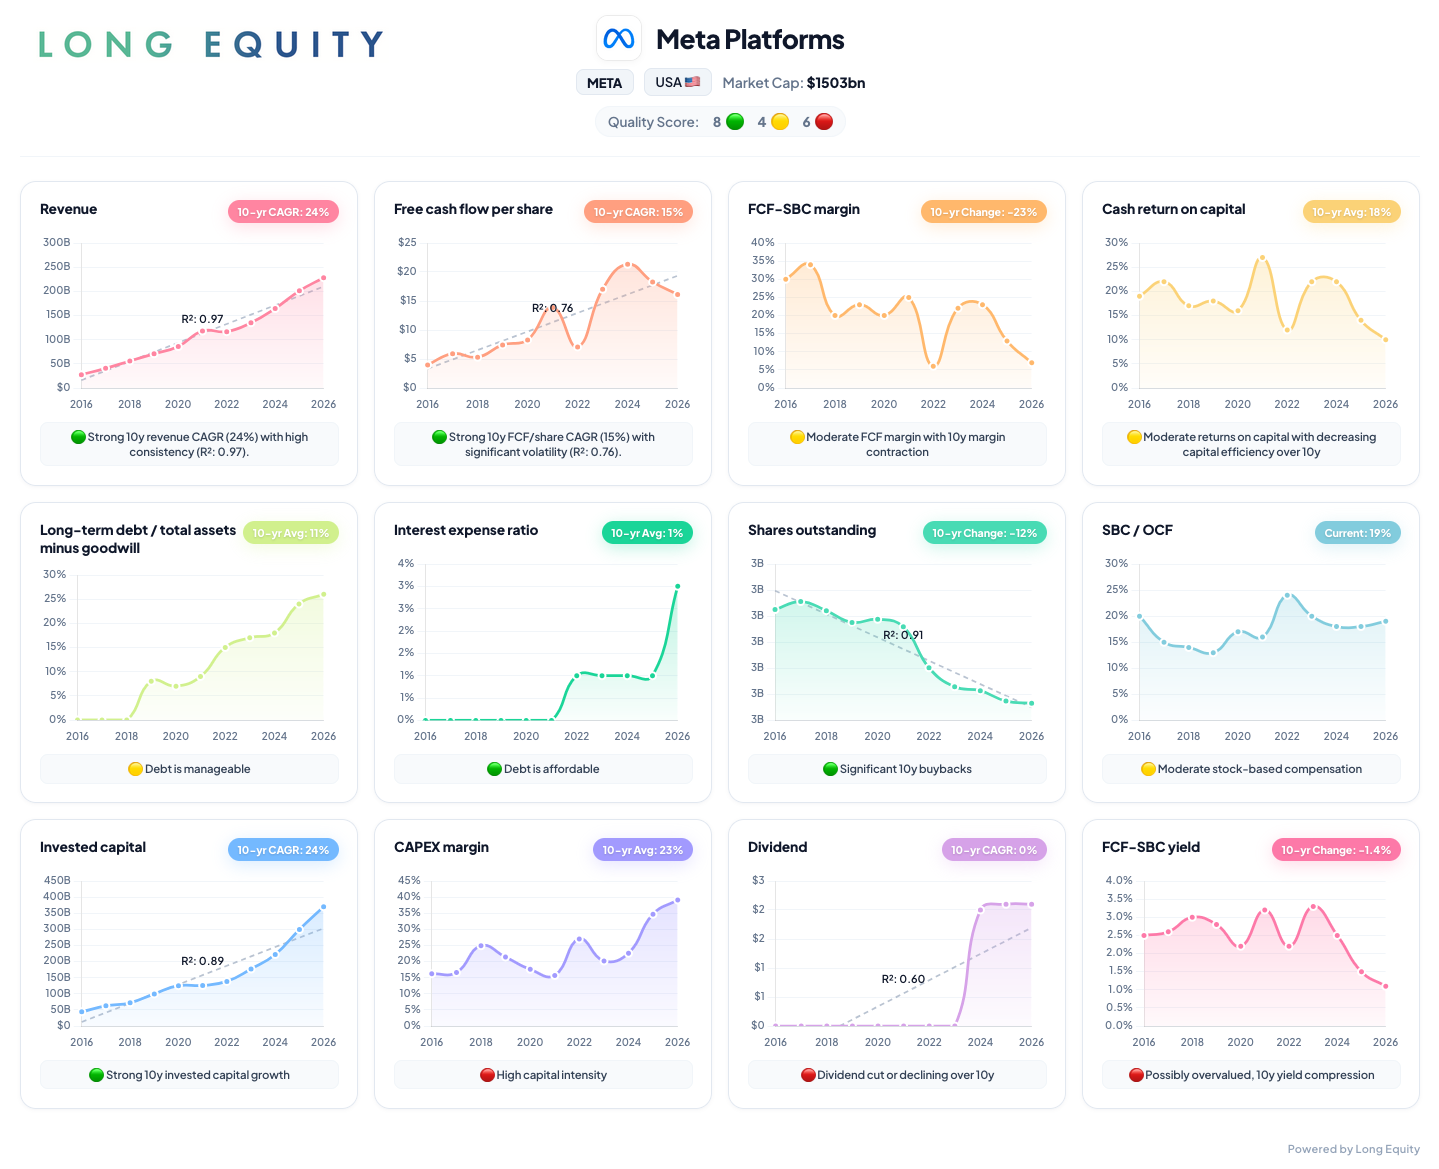
You can click on each company to open up its financials in the the Data Visualiser. Each metric in the visualiser comes with a rating and a summary, to help further examine what's been driving performance.
Linearity analysis
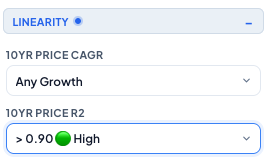
If you've been following Long Equity for a while, you'll know that I often use share price linearity as a source of new ideas. The terminal has share price linearity built-in.
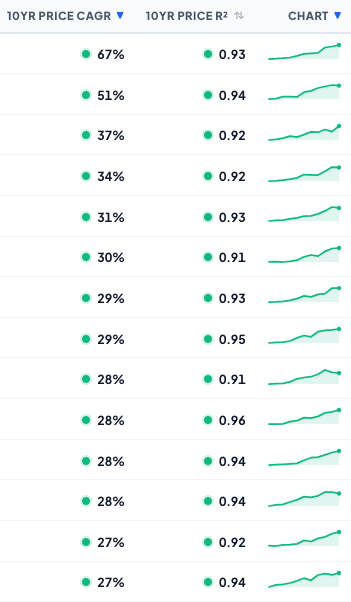
You can easily sort by and filter by R2, which is the correlation coefficient. The higher this number is to 1.00, the closer the line is to being perfect.
Business model analysis
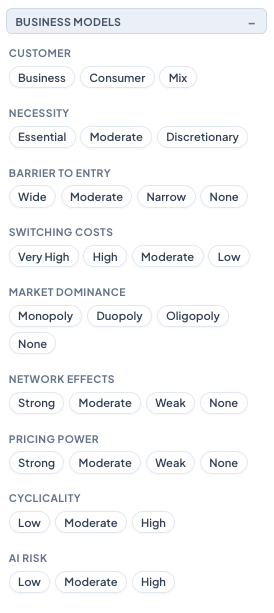
In addition to financial metrics, the terminal breaks down the companies business model. This allows you to screen for companies based on:
- Customer - are they selling to consumers or other businesses?
- Necessity - are they selling something essential or discretionary?
- Barrier to entry - is the barrier to entering the market narrow or wide?
- Switching costs - is the switching cost to move to a competitor low or high?
- Market dominance - is the company in a monopoly, duopoly or oligopoly, or does it not have any market dominance?
- Network effects - does the company benefit from weak or strong network effects?
- Cyclicality - is the company exposed to high or low levels of cyclicality?
- AI Risk - does the company face low levels or high levels of AI disruption risk?
This is all captured in the database.

And you can also screen for each metric too:
Valuation Calculator
Lastly, once you've found a company that interests you, you can then move to determining whether it's trading at an attractive price.
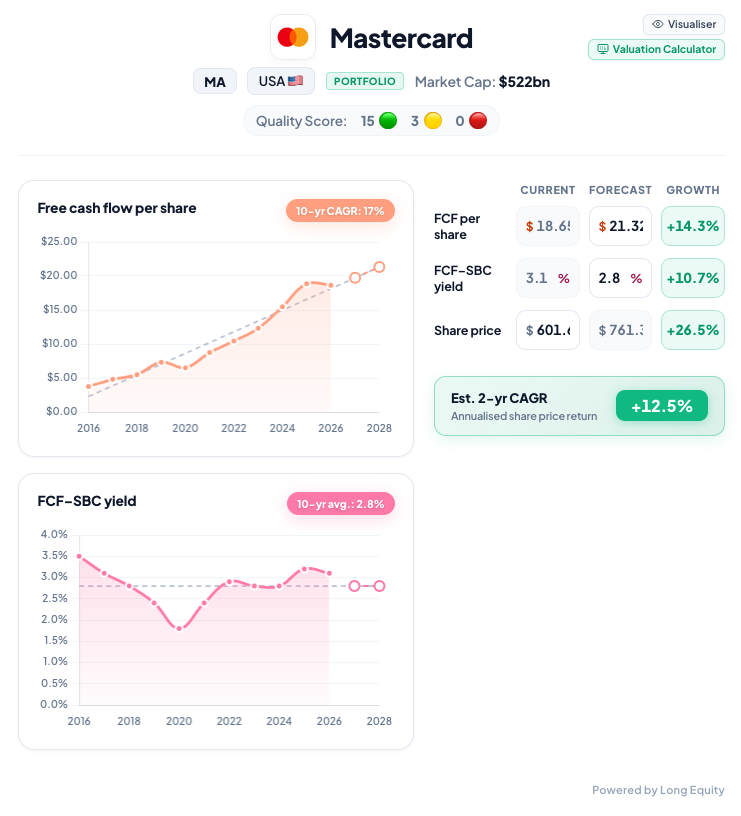
The Valuation Calculator estimates each company's growth rate over the next 2 years this using three inputs.
- The first input is the forecasted FCF per share. The calculator estimates this automatically by applying a linear regression. You can manually adjust this based on your own forecast. In the below example, our forecast is $21.32. This is equivalent to 14.3% growth.
- The second input is the forecasted FCF-SBC yield. The calculator estimates this automatically by assuming that the company's yield will revert to the average. While this may often happen for some companies, it certaintly doesn't happen for all. Therefore, the calculator allows you manually to input your own forecast. Companies that have seen their quality materially improve or deterioate may in time see their FCF yield settle on a number that better reflects their current quality. In the below example, our forecast is 2.8%. This is equivalent to 10.7% growth.
- The third input is the current share price. As share price is constantly changing, the calculator lets you input the latest value to ensure that you're calculating the very best estimate.
Updating these three inputs then outputs two estimates: the growth rate and the annualised growth rate over 2 years. For example if we see FCF per share grow 14.3% to $21.32, and if we see FBC-SBC contract to 2.8%, then this would generate 26.5% share price growth. Assuming this takes two years to materialise, then the estimated 2-year CAGR would be 12.5%.
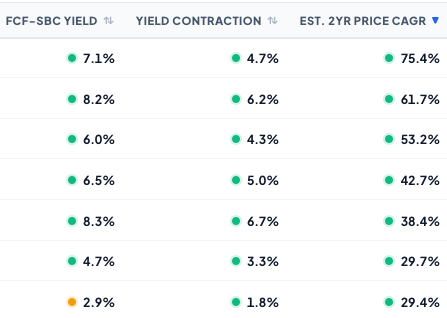
The automatically calculated estimates by the Valuation Calculator are also set out in the Database (see "Est. 2ry Price CAGR"), alongside the current FCF-SBC Yield and the Yield Contraction (which is the difference between the current yield and the yield 5 years ago).
Built-in screens
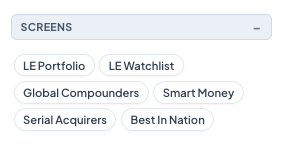
There are currently five built-in screens.
- LE Portfolio - this displays the companies currently in the Long Equity Portfolio. The portfolio typically holds 10-12 companies.
- LE Watchlist - this displays the companies currently on the Long Equity Watchlist. The watchlist is typically between 10-2o companies.
- Global Compounders - this displays typically between 100-150 above average quality companies from around the world.
- Smart Money - this displays the companies held by at least two out of ten quality-focused fund managers.
- Serial Acquirers - this displays companies that typically use the serial acquirer business model, i.e. continuously buying cash-generating businesses (often in fragmented markets) and then redeploying the collective cash flows into further acquisitions, all under a decentralised operating structure.
- Best in Nation - this displays the top two highest scoring companies in each country.
Concluding thoughts
The Long Equity Data Terminal brings together into a single interface: quality scoring, business model analysis, share price linearity, and dynamic valuation modeling.
Whether you are hunting for highly predictable compounders across global markets or stress-testing return expectations on your watchlist, the platform is designed to take you from initial idea generation to an actionable valuation in minutes.